The Dashboard Toolbar
The dashboard toolbar is displayed at the top of every page of the dashboard.
Toolbar for main page:

Toolbar for trend graphs:
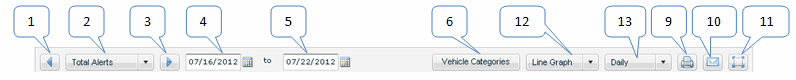
1: |
Move to the previous page of the dashboard (for navigating between the main page and trend graphs). |
2: |
Select a page by name from the drop-down list. The main page is called KPIs. Trend graphs are labeled by the data they show. |
3: |
Move to the next page of the dashboard (for navigating between the main page and trend graphs). |
4: |
The start of the time period that the dashboard summarizes. |
5: |
The end of the time period that the dashboard summarizes. |
6: |
Select Vehicle Categories to filter the counts to represent only certain categories of vehicle. |
7: |
Select Settings to configure the thresholds for colors on the main page. |
8: |
The Percentage/Count toggle lets you toggle whether the main grid shows percentages or counts. |
9: |
Select Print to send information on the current page to the printer. |
10: |
Select Email to send an email that contains the information on the current page. |
11: |
Select Full Screen to switch to full screen mode to increase the display area. |
12: |
Select an option from the graph type drop-down list to configure the appearance of trend graphs. |
13: |
Select an option from the frequency drop-down list to specify the frequency of points on trend graphs. |
 Previous
 Next
Next Expand/Collapse
 Print
Print Share Page
 Training
 Knowledge