The Reports Queue
The Reports screen lists the simple custom reports and built-in reports that have been run, that are currently running, or that are scheduled to run as soon as possible.
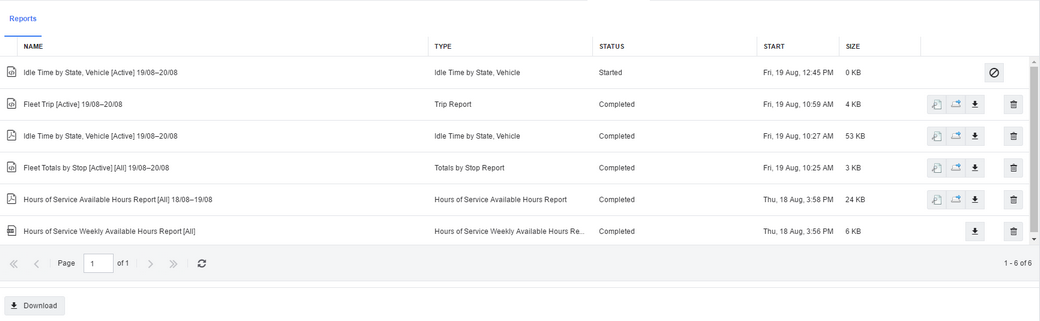
The top part of the screen lists the reports or report data that has been or is about to be generated. Each row lists:
| • | An icon that indicates the output format. |
| • | The name of the report or data set. |
| • | The type of report. |
| • | The status of the report. This can be one of the following: |
|
| • | The time when the report started running. |
| • | The size of the generated file. If the status is not "Completed", this value is 0. |
| • | Tools that let you view, download, cancel, or delete the report. |
The lower part of the screen displays the currently selected report (if you click the  icon to view it on this page). You can click Download to download the displayed report.
Tool Icons
Click the icons in the view controls columns to view a report once it is completed. These controls are as follows:
|
View the report in the lower part of this page. This icon is displayed when a report has been successfully generated. |
|
View the report in a separate web page. This icon is displayed when a report has been successfully generated. |
|
Download the report to your local machine. This icon is displayed when a report has been successfully generated. |
|
Cancel the report generation. This icon is displayed while a report is being generated. |
|
Delete the report from the system. |
 Previous
 Next
Next Expand/Collapse
 Print
Print Share Page
 Training
 Knowledge


