Maintenance Connect
|
The Maintenance Connect feature is not available in all accounts. If your subscription does not include this feature, management of your fleet's maintenance schedules can be carried out from the Maintenance Log. Vehicle trouble codes can also be identified using the API tools provided for Insight Alert Scripts if your fleet contains suitably configured vehicles. |
The Maintenance Connect console allows your business to:
| • | Monitor Diagnostic Trouble Codes (DTCs) broadcast by the vehicles in your fleet if and when their onboard diagnostics systems detect a vehicle fault, and identify the nearest service center to a given a vehicle if immediate action is required. |
| • | Create service plan templates that indicate the cost of a service (based on individual labor, parts, tax, and discount components), and the intervals at which these service types should occur. |
| • | Apply maintenance schedules to individual vehicles based on pre-configured service plans. |
| • | View the service history logs of vehicles in your fleet, and manually add or edit or remove them. |
| • | View DVIR forms completed and uploaded by drivers and mechanics using the Verizon Connect® WorkPlan™ mobile application. |
When a fault code is detected, or a vehicle fails to complete a scheduled maintenance service, the console alerts you using the Insight Alerts system. These alerts are indicated by a pop-up message, and an email. Alerts provide an indication of the fault or issue's severity, advise of any actions required, and locate the nearest service facility at which a mechanical and electrical diagnosis can be performed, or repairs completed.
Maintenance Connect can be used as the central management point of your fleet-wide vehicle maintenance schedules, to track the service histories and service plans and schedules of individual vehicles, providing alerts and reports when a vehicle develops a fault or if any vehicles miss their scheduled maintenance visits. It also integrates with fault cases when they are lodged within external fault case management service platforms, if your account includes this option.
Using the Maintenance Connect Screen
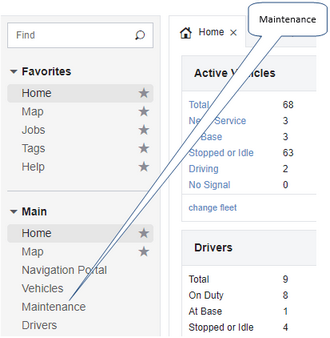
From the Main section of the navigation bar choose Maintenance.
The main components of this screen are as follows:

1: |
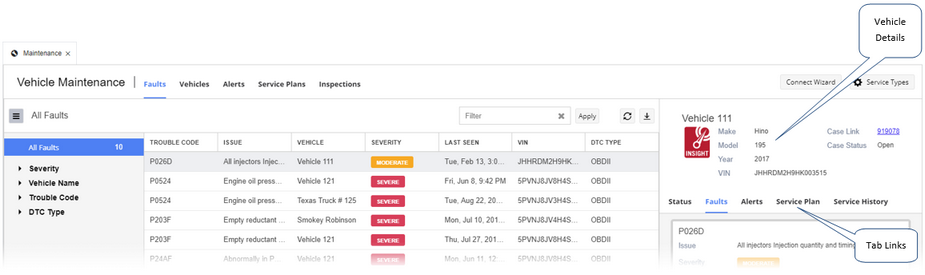
The Tree menu to the left of the screen is used to group faults of the same type, vehicle values of the same type (such as model, make, and year), and service plans by their provider. Click the menu button After you select a node in the tree, the main grid is populated by the content of the node you selected. Click a column header in this main grid to sort the items shown by each column type (sorting is carried out alphabetically or numerically). |
||||||||||
2: |
The four main menu links are used to switch between the four available views:
|
||||||||||
3: |
The List Grid contains rows of records that detail the fault codes logged, service plans configured, or the vehicles within your fleet. The columns available, and the information they display, vary depending on the Maintenance tab that has been selected. See the Grid List Columns section below for more information about the columns available on each tab. |
||||||||||
4: |
The List Filter is used to manually filter the item list. Enter a string that matches all or part of an item, then press the Enter key. Only items in the currently selected item list that include the text you filtered on are displayed. To reset the filter, click the Clear "x" button to the right of the field. Click Refresh to update the grid or filter selection at any time. |
||||||||||
5: |
The Export button |
||||||||||
6: |
The Details Window displays information about the vehicle or service plan selected on the List Grid. It also displays a link to the external case relating to the reported fault, and the current status of that case, if your account is configured to use a third-party case management tool. When the Faults tab is selected, the Details Window shows basic DTC fault details reported by vehicles. You can use the filter on the left of the screen to group faults by their severity, by vehicle name, by trouble code, or by DTC type. When the Vehicles tab is selected, the Details Windowshows the vehicle's make, model, year, and VIN. A map of the vehicle's location is also displayed, plus the driver's details and the vehicle's nearest service center. When the Service Plans tab is selected, this window displays the schedule types associated with the selected plan, and also shows a tab where you can view the vehicles that have been assigned the plan. |
||||||||||
7: |
The Maintenance Connect Wizard is used to configure alerts for all vehicles in your fleet (for example, maintenance alerts, vehicle performance alerts, and trouble code alerts), the types of reports you will receive on these alerts and their frequency, and to specify your nearest or preferred service center. These service types are packaged together to become a service plan, which is then applied to multiple vehicles. See the Configuring Vehicles in the Maintenance Connect Wizard section for more information. |
||||||||||
8: |
The Service Types tool is used to manage, create, and remove service types. These describe the components of a particular type of service that are performed on the vehicles in your fleet, and can be used to describe everything from a minor oil change or tire inspection and rotation, to a full engine rebuild. See the Adding, Editing and Removing Service Types section for more information. |
||||||||||
The Details Window displays summary information about the currently selected vehicle, InSight Alert, or service plan in the List Grid. This panel also includes five tabs that provide more detailed information:
|
|||||||||||
The columns of information available on the List Grid are: Faults tab:
Vehicles tab:
Alerts tab:
Service Plans tab:
Inspections tab:
|
 Previous
 Next
Next Expand/Collapse
 Print
Print Share Page
 Training
 Knowledge
 in the upper left corner of the screen to open or close the tree menu. When the menu is open, the number of vehicles, faults, and service plan providers that are nested within each node level in the tree node is indicated by a number to the right of each node. Nodes are typically ordered in the tree according to the number of items they contain, with the highest at the top. Faults, however, are grouped by severity rather than the number of faults found. Faults with a status of
 is used to export the current